We use cookies to make your experience better. To comply with the new e-Privacy directive, we need to ask for your consent to set the cookies. Learn more.
Seasonal Stocks S&P 500: Sell in May and go Away, Fu**in True

![]() Seasonal Stocks: what are the pattern that the S&P is following most of the years
Seasonal Stocks: what are the pattern that the S&P is following most of the years
![]() What are the best months to buy stocks? And when is better to close the positions
What are the best months to buy stocks? And when is better to close the positions
![]() How BTM expert advisors increase the profitability of the seasonal S&P pattern with a low risk.
How BTM expert advisors increase the profitability of the seasonal S&P pattern with a low risk.
FACTS, NOT OPINIONS
I heard it several times: 'sell in may and go away' but I had never analyzed S&P 500 historical data to discover if seasonal stocks behaviour is an urban myth or a reality.
When I saw this chart I decided to analyze S&P 500 better. The following chart shows the average movement during a year of S&P 500 since 1950.
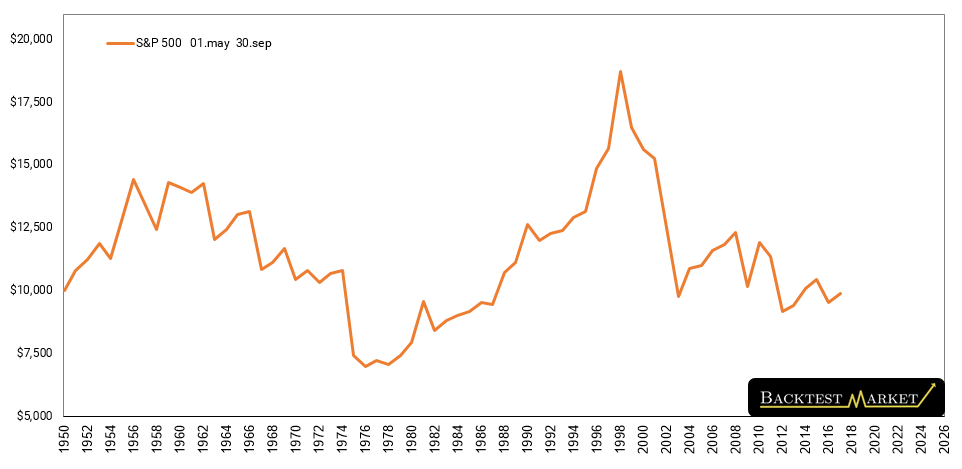
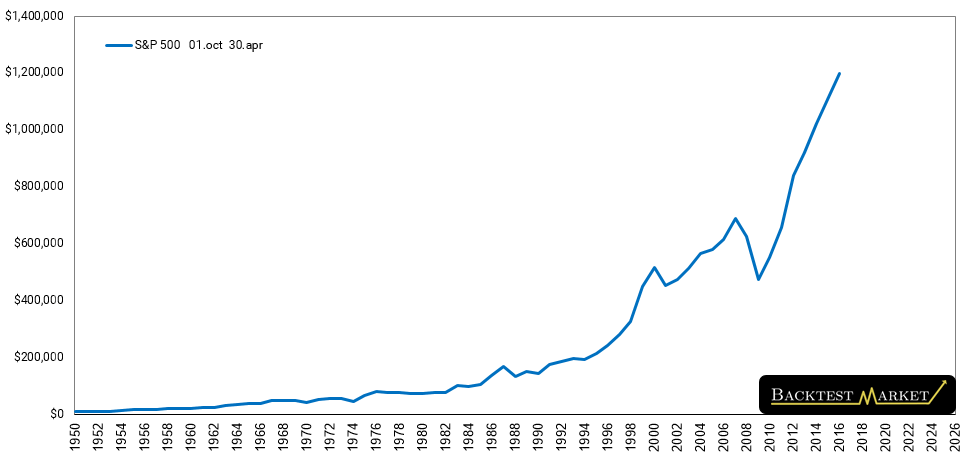
The seasonal pattern of S&P 500: 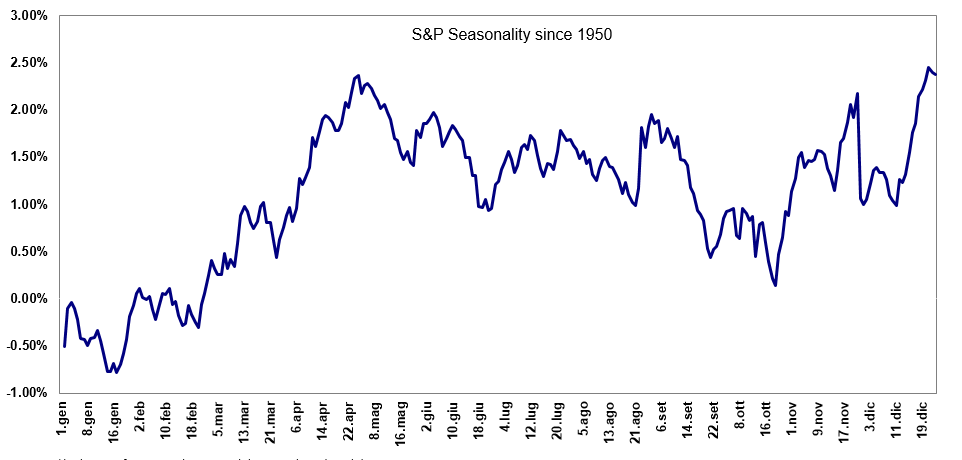 So I divided the years in 2 periods:
1°. from 1.May to 30.September
2°. from 1.October to 30.April.
Then I created a simple excel function to simulate the investment of a starting capital of 10,000$ for each of those 2 periods. Those are the results:
1°. from 1.October to 30.April (1950-2017)
2°. from 1.October to 30.April (1950-2017)
Comparison
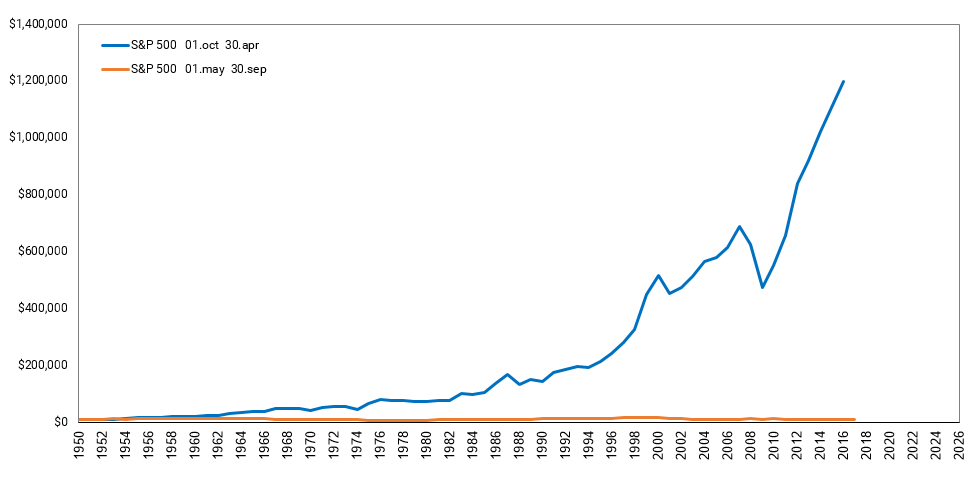 The first time I saw those 3 charts I said: "Wow so it is fu**in true!" The result is very clear: seasonal stocks behaviour's it's not just an hurban myth as I thought.
| 01.May 30.Sep | 01.Oct 30.Apr | |
|---|---|---|
| Profit | -112$ | 1,160,217$ |
| Avg% | 0.39% | 8.80% |
| %up | 64% | 71% |
It can't be casual -1% vs +11,602%. The big guys sell in May and go away for real. So I realized that to optimize the S&P investment it's better go long in October (year 1), close the position in May (year 2) and re-buy the next October (year 2).
But even if this pattern it seems very powerfull it is not unfailing. S&P follows most of the years the seasonal pattern, but not all of them. From October to April S&P has climbed 46 times out of 66 (71%) with an average gain of 8.80%.
Instead in May-September periods S&P has gone up 64% of the times but with an average gain of just 0.39%.So it's clear that October-April's bull trends are a lot more stronger than May-September ones.
S&P Accumulators Expert Advisors
Then I thought about how to use this information automatically. Maybe better by increasing profitability and reducing the drawdown, with a low risk.
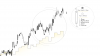
Below there are 2 screenshot of an S&P Accumulator, in backtest's visual mode: 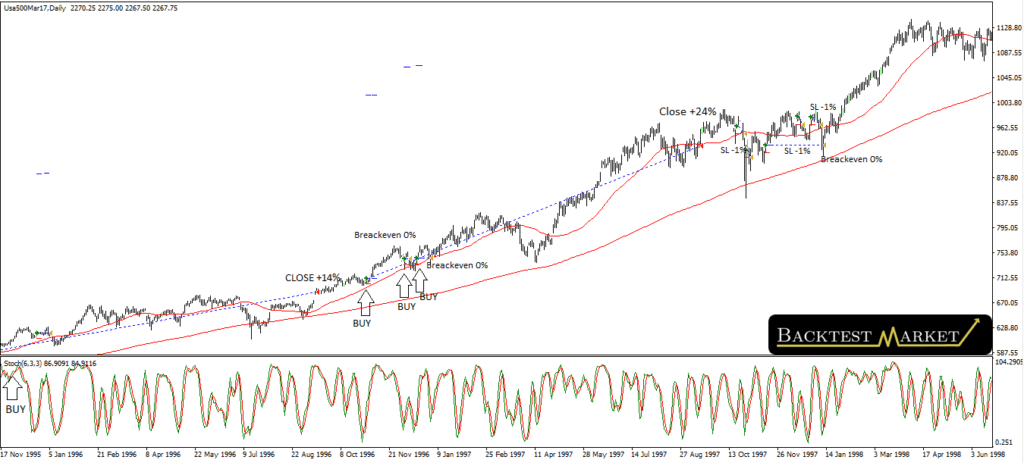
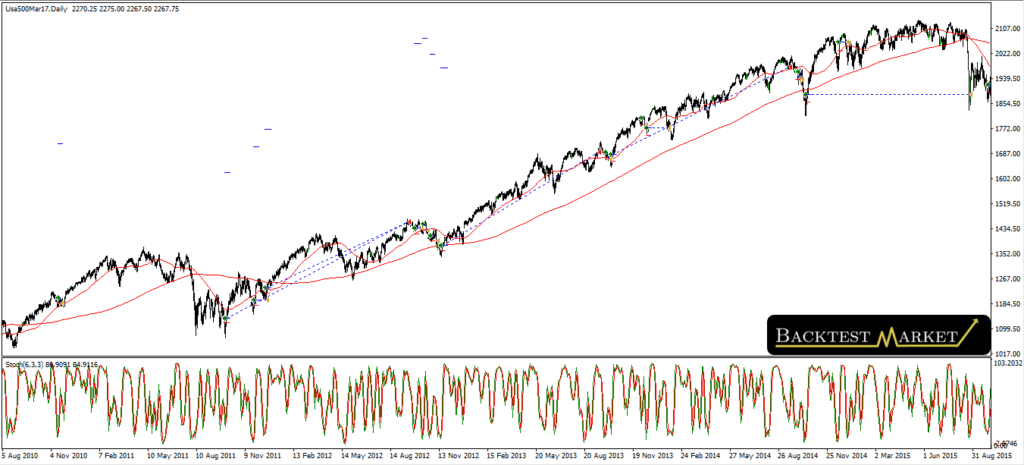 The robots don't buy just after reading the month, but they find the best buy opportunities. After opening the position with the correct risk, they manage the trade with stop loss, free-risk target, trailing stop and take profit.
Each expert will open an additional position only if the previous one has gone free-risk. Stop losses are generally tight, to open more lots with the same risk. The average payout is 8 times higher than the average loss.
The S&P Accumulators Portfolio
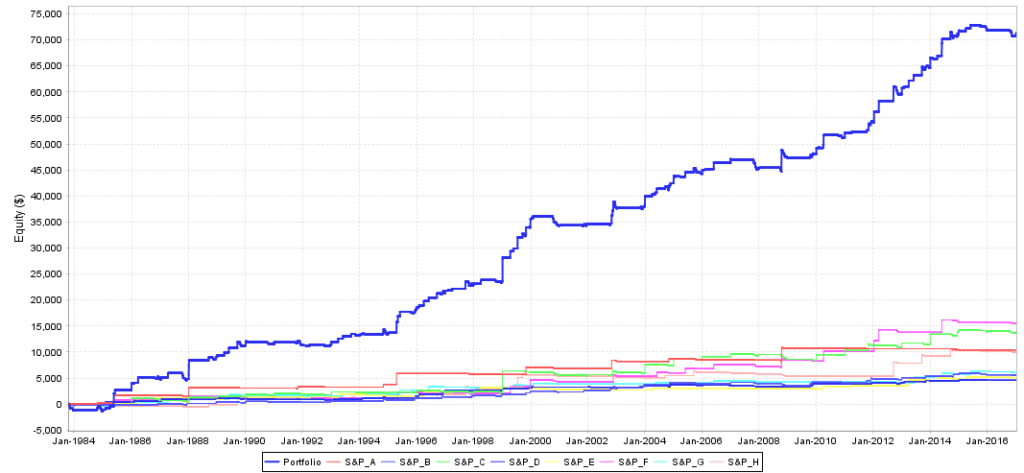
BTM currently offers Accumulators Portfolio at a very affordable price. The portfolio is composed by S&P Seasonal Accumulators and Gold Accumulators Expert Advisors, built on a 50 years primary cycle analysis: Gold Forecast: the primary cycle on Gold.
I believe that statistics built on more than 50 years give to Accumulator Portfolio Expert Advisors big chances to continue working well at least in the coming 10 years.
About the Author

Related Products

MT4 vs MT5 - A comparison
August 24, 2018
How to backtest an Expert Advisor in Metatrader
January 7, 2018

Is 2011 Precious Metals Bull Market Top, a Major Peak like 1980?
October 3, 2017

High Potential Days Strategy
September 29, 2017

What is Continuous Futures Data and Back-Adjustment
June 6, 2023
What is Continuous Futures Data and Back-Adjustment
June 6, 2023
The worth of 1 pip in EUR USD
August 10, 2021


FOREX TRADING: IT'S ALL IN THE EXCHANGE
January 7, 2020

The Best Automated Trading Software is not enough
October 6, 2019